

Whether or not you realize it, we rely on geospatial data analysis every single day in our modern world. Geospatial data analysis involves collecting, combining, and visualizing various data sets that represent people, places, and things on Earth. On any given day, you might use GPS to meet your friend at a new restaurant in town or search for a healthcare provider near your home. Geospatial analysis enables our day-to-day lives to run seamlessly. Accordingly, it’s become more important than ever for organizations to leverage geospatial analysis for data analytics and business intelligence needs.
Geospatial data contains information that corresponds to geographic entities. This includes countries, counties, zip codes, legislative districts, addresses, and more. Geospatial analysis involves investigating the underlying trends and relationships within your data, based on the geographic location and spread of data points.
What is Geospatial Analysis Useful for?
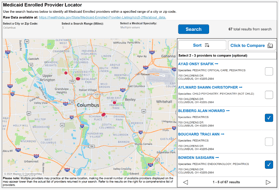
Geospatial analysis moves reporting away from standard tabular format (rows and columns) and into more intuitive and familiar formats for end users, such as map visualizations. Maps remove the guess work of sorting through rows, bars, or other visual marks and allow end users to directly find the data they need.
Better yet, maps should serve as the foundation for gathering additional insights about individual geographic entities. For example, the State of Ohio’s COVID-19 dashboard allows users to click on an individual county to see trends in cases, hospitalizations, and deaths in the selected county over time.
The COVID-19 pandemic is an excellent example of geospatial analysis in action. Governments, healthcare systems, and organizations around the globe were tasked with the incredibly difficult challenge of mitigating the impact and spread of the virus. By pairing geospatial information from COVID-19 case records with geographic boundaries for states, counties, zip codes, and more, organizations were better equipped to monitor, intervene, and prevent further spread of the virus.
 Beyond the COVID-19 pandemic, geospatial analysis has provided immeasurable value in election reporting, urban planning, weather forecasting, and so much more. Practically any organization can benefit from the enhanced insights offered by pairing existing data assets with geospatial analysis.
Getting Started
The first step in your geospatial analytics journey is often a question: What geographic entities would enhance our understanding of the trends in our data? For some applications like Tableau, the boundaries for several common geographic entities like states, counties, and zip codes may be a recognized geographic data type. In other cases, your organization might benefit from customized geographic entities for regions or service districts that don’t neatly align with more commonplace geographies like counties.
If your existing reporting tools and technologies do not have boundaries for geographic entities preloaded, several packages and libraries are available to provide these mappings in free, opensource programming languages like Python and R.
Several government agencies and research organizations—such as the United States Census Bureau—also provide free, public data sets containing valuable measures on population demographics, health, economic measures, and more across a range of geographic entities. Public data sets can supplement existing organizational data assets and fill gaps in information.
With geographic boundary mappings and organizational data assets at your disposal, you can begin building visualizations and reports to answer your organization’s most pressing questions. For example, is a particular area worth investing in? Are healthcare providers offering services in areas where they are needed? How often are people visiting a particular location and how long do they stay? For insurers, does the amount of traffic and time in place contribute to risk factors? As your organization matures with geospatial analysis, consider the following activities to elevate your analytics to the next level:
- Implement data management standards to monitor geographic trends over time
- Adhere to design standards and best practices for geospatial visualizations
- Embed reporting in a central location that is accessible to your team
- Curate and enable public reporting of your geospatial trends to promote data transparency
Interested in incorporating geospatial analysis into your data and analytics strategy? Reach out to get started.