

Change is everywhere. The average organization today has undertaken five large-scale changes in the past three years, with expectations of multiplying this number in coming years. Big or small, many of these changes are either directly driven by technology or have a strong technological component. Digital transformation efforts average a failure rate of nearly 70 percent, despite the right intentions.
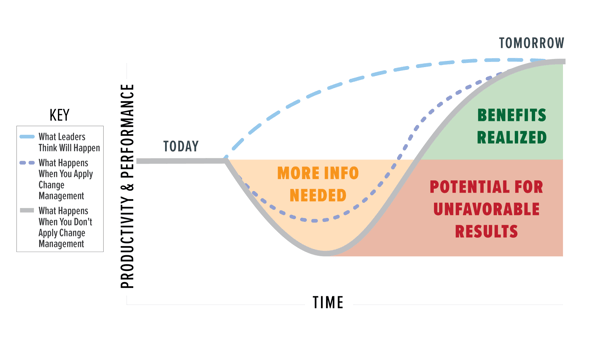 How can organizations beat the odds? The amount of deliberate communication and strategy for how you engage your people affects how disruptive change is to a business. Leaders must ensure they are approaching both the technical and people aspects of change to minimize a dip in productivity and disruption. This means accounting for organizational needs, timelines, and budget, as well as connecting change initiatives to strategy, identify change readiness and risks, and removing barriers to change.
Today, we are sharing how we are seeing some of our clients leverage data analysis tools and dashboards to help them better sponsor and lead change.
How to Leverage Data in Change
Change initiatives are risky endeavors, no matter how beneficial in the long run. Strong change management relies on information to inform decisions, measure change impact, and respond to business and individual needs. Cue change analytics. Change analytics adds measurable value to change management, enabling trend visualization and turning data into actionable information.
Change analytics can measure various change factors, including readiness for change, how employees are handling change, how the organization is adopting the change, and what levers of the strategy are most effective and allow you to better support individuals through change. Data sources that can be leveraged for change analytics dashboards include:
- Stakeholder impact assessment - Generates impact scores to understand stakeholder’s reactions, attitudes, motivators, resistance, potential barriers, and influencers that can contribute to or impede successful transformation.
- Complexity assessment - Generates the scope, resistance, and complexity scores to be used in the complexity matrix dashboard.
- Survey data - Can be used for sentiment, pulse tracking, etc.
- Human resources data - Provides organizational-level data which can be used to filter dashboards for leader-specific impacts.
- Project management tools - Provides project characteristics to help PMOs understand complexity, size, scope, and impact data, to understand their change portfolio – measuring how different areas of the organizations handle change.
Data in Action
Use Case: ABC Company is planning and undergoing various transformation projects that are going to affect many different stakeholder groups across the organization at various times. Change leaders need to balance how much change is happening within the organization to minimize change saturation and ensure adoption, while also focusing on executing the day-to-day needs of the business.
Senior leaders want to understand who these initiatives are going to impact within various parts of the organization and where they will run into issues with too much change and conflicting efforts. They also wanted to see the impact of these changes across the organization. Their challenges include not having a single point of truth, with all the project-related information and data spread across multiple sources.
Leveraging a change analytics approach allows the organization to visualize this data, helping to identify quick wins. A couple examples include visualizing HR data to easily identify impacted stakeholders and mapping project go-lives on a timeline to understand overlap.
Getting Started
This may seem like a lot to take on and manage, especially if your change management team has little to no expertise in analytics. Partnering with an organization like Avaap, who brings deep expertise in both change management and data analytics, can help you learn in real time how change is being perceived. Custom dashboards can be created to meet the needs of each organization, are technology agnostic, and serve as a platform for ongoing analysis and understanding of your people and change initiatives.
Josh is a Principal Consultant in our Organization Transformation Solutions Practice with demonstrated experience across various industries leading strategic transformation efforts. His skills span change management, project planning and execution, workshop facilitation, process improvement, and data and analytics. Josh has a passion for leveraging data to help inform decision making and helps clients leverage data to inform and manage their change and transformation efforts. He holds a Bachelor of Science in Business Administration from The Ohio State University Fisher College of Business and is a lifelong learner, always looking to learn new skills and grow his skills and knowledge around business and technology.